Key Takeaways
- PageSpeed Insights shows two different things: real-visitor data from Chrome users over the last 28 days, and a lab test that produces the 0–100 score.
- The real-visitor section decides your Core Web Vitals result, the speed signal Google Search uses. The score is a diagnostic, not a ranking.
- The score is a weighted average of five lab metrics: Total Blocking Time (30%), Largest Contentful Paint (25%), Cumulative Layout Shift (25%), First Contentful Paint (10%) and Speed Index (10%).
- 90–100 is good, 50–89 needs improvement and 0–49 is poor. Google says a perfect 100 is "extremely challenging" and not expected.
- Start with the slowest metric, not the score: a slow server shows up in TTFB, heavy images in LCP, and too much JavaScript in TBT.
What Is PageSpeed Insights?
PageSpeed Insights (PSI) is Google's free tool that reports how fast a page loads and responds, on mobile and desktop, and suggests how to improve it. You paste a URL at pagespeed.web.dev and get a report in about a minute. It's free, needs no account and works on any public page, including your competitors'. It sits alongside the other free SEO tools worth keeping bookmarked.
Google's PageSpeed Insights documentation explains that the report combines two sources: field data from the Chrome User Experience Report (CrUX), which records real Chrome users' experiences over the previous 28 days, and lab data generated by Lighthouse, which simulates a single page load. Almost every confusing thing about PSI comes from mixing those two up.
How to Read a PageSpeed Insights Report
Read it top to bottom: real visitors first, then the lab score, then the metrics, then the suggestions.
- Pick the tab. PSI opens on Mobile, which matters most because Google indexes the mobile version of pages. Desktop scores are usually higher.
- Read "Discover what your real users are experiencing". This is field data. If it says the Core Web Vitals assessment passed or failed, that's the verdict that counts. Use the toggle to switch between this URL and the whole origin (your site).
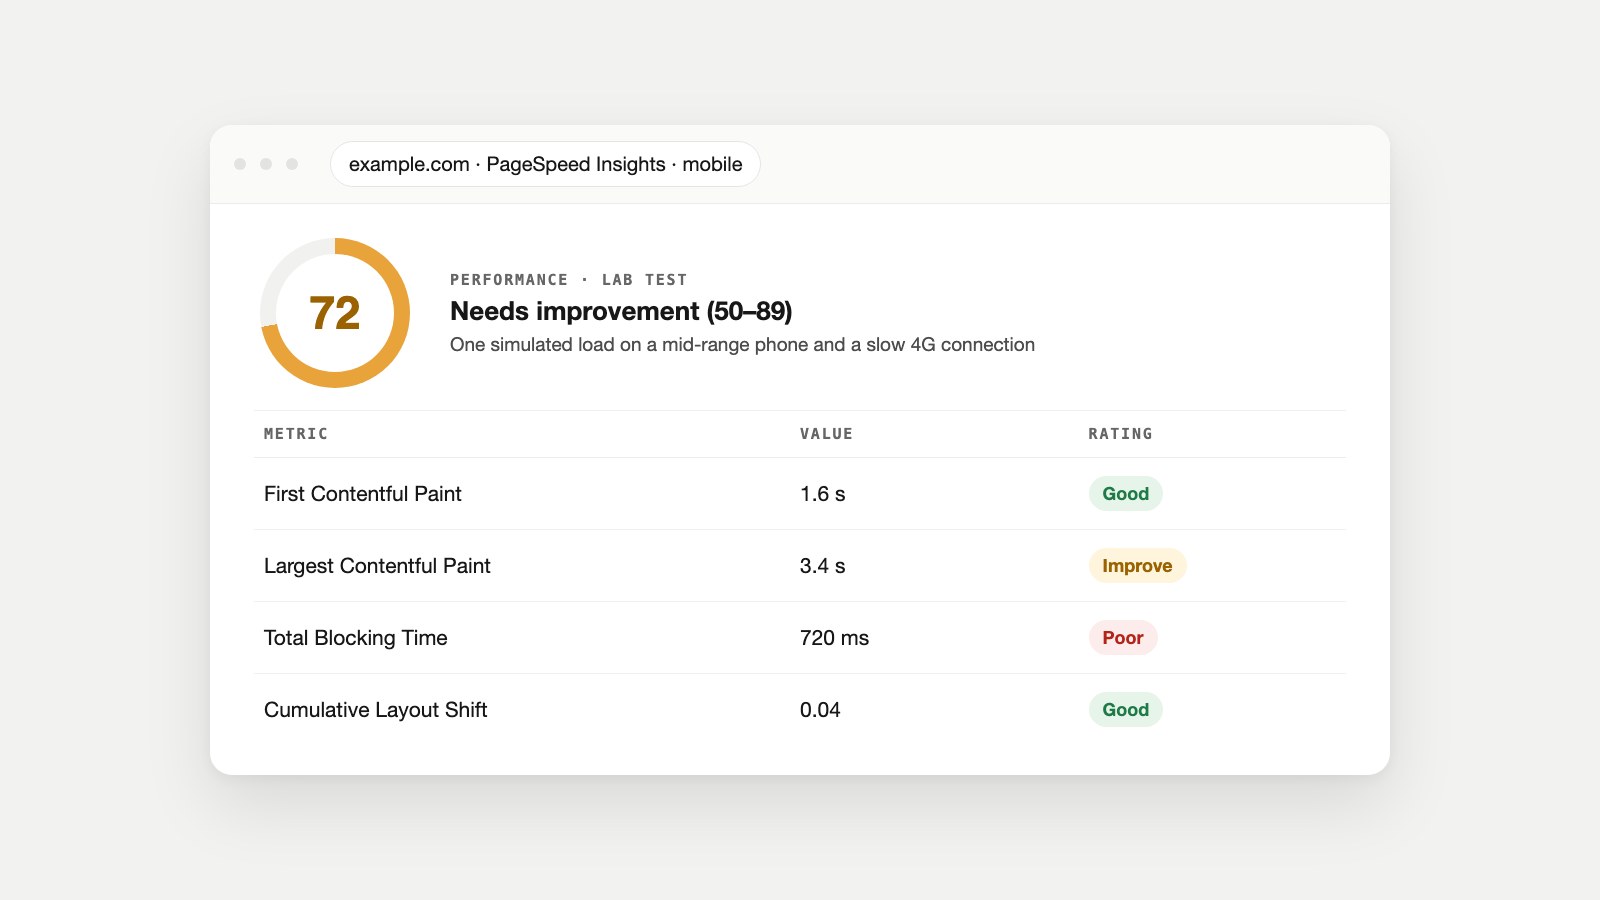
- Then read "Diagnose performance issues". This is the lab test: the big score and five metrics, each colored green, orange or red.
- Find the worst metric. The color tells you which one is pulling the score down.
- Read the Insights and Diagnostics. These list the specific causes, such as render-blocking resources, oversized images or long main-thread tasks, often with an estimate of the time each would save.
- Ignore the parts that don't apply to your platform, and fix the biggest, cheapest wins first.
If the real-visitor section says there isn't enough data, the page is too new or gets too few Chrome visitors. PSI then falls back to data for your whole site, and if that's missing too, you only have the lab test to go on.
Lab Data vs Field Data: Why They Disagree
Field data is what real visitors experienced; lab data is one controlled test. They often disagree, and when they do, field data is what Google uses to judge page experience.
| Category | Field data (real visitors) | Lab data (Lighthouse) |
|---|---|---|
| Source | Chrome User Experience Report | One simulated load |
| Time period | The previous 28 days | Right now |
| Device and network | Your actual visitors' phones and connections | A mid-range phone on a throttled connection |
| Value shown | The 75th percentile | A single run |
| Measures interaction (INP)? | Yes | No: uses Total Blocking Time instead |
| Used for Core Web Vitals? | Yes | No |
| Best for | Knowing if you have a problem | Finding why, and testing fixes |
web.dev's guide to why lab and field data differ lists the usual reasons: visitors' devices and networks vary, real visitors often have the site cached, logged-in or personalized pages behave differently, and the lab test never scrolls or taps. A page can score 95 in the lab and still fail its Core Web Vitals in the field, or the reverse.
The 75th percentile is how PSI summarizes field data: the value that three out of four visits were better than. It's chosen, in Google's words, so developers can understand "the most frustrating user experiences on their site."
What Your PageSpeed Score Means
The performance score is a weighted average of five lab metrics, from 0 to 100. Chrome's Lighthouse scoring documentation gives the current weights and color bands:
| Metric | Weight | What it measures |
|---|---|---|
| Total Blocking Time (TBT) | 30% | How long the page is too busy to respond while loading |
| Largest Contentful Paint (LCP) | 25% | When the main content appears |
| Cumulative Layout Shift (CLS) | 25% | How much the layout jumps |
| First Contentful Paint (FCP) | 10% | When anything first appears |
| Speed Index (SI) | 10% | How quickly the visible page fills in |
Scores of 90–100 are good, 50–89 need improvement and 0–49 are poor. Don't chase 100: Lighthouse's documentation calls a perfect score "extremely challenging to achieve and not expected," and notes that going from 99 to 100 takes about as much improvement as going from 90 to 94.
Why does the score change every time I run it? Because it's one simulated load on shared infrastructure. Server response times, third-party scripts and ads all vary between runs, so a few points' difference is normal. Run it three times and look at the typical result, and trust field data for the long-term picture.
Every PageSpeed Insights Metric Explained
These are all the metrics PSI shows, with the thresholds from Google and Chrome's documentation. Field thresholds apply to real-visitor data; the lab-only metrics use Lighthouse's mobile thresholds.
| Metric | Good | Poor | Where it appears |
|---|---|---|---|
| First Contentful Paint (FCP) | 1.8 s or less | Over 3.0 s | Field and lab |
| Largest Contentful Paint (LCP) | 2.5 s or less | Over 4.0 s | Field and lab (Core Web Vital) |
| Interaction to Next Paint (INP) | 200 ms or less | Over 500 ms | Field only (Core Web Vital) |
| Cumulative Layout Shift (CLS) | 0.1 or less | Over 0.25 | Field and lab (Core Web Vital) |
| Time to First Byte (TTFB) | 0.8 s or less | Over 1.8 s | Field only (experimental) |
| Total Blocking Time (TBT) | 200 ms or less (mobile) | Over 600 ms | Lab only |
| Speed Index (SI) | 3.4 s or less (mobile) | Over 5.8 s | Lab only |
LCP, INP and CLS are the three Core Web Vitals. Our guide to what Core Web Vitals are explains each in depth, with the fixes that move them. The rest are covered below.
First Contentful Paint (FCP)
FCP measures how long it takes for the first text or image to appear. It's the moment a visitor sees something happening instead of a blank screen. web.dev's FCP guide sets good at 1.8 seconds or less and poor at over 3 seconds. A slow FCP usually means a slow server, render-blocking CSS or JavaScript in the <head>, or web fonts that keep text invisible while they load.
FCP vs LCP: FCP is the first thing to appear, often a logo or a heading; LCP is the largest, usually the hero image or main text block. A page can paint something quickly and still take a long time to show what people came for.
Time to First Byte (TTFB)
TTFB measures how long the browser waits for the first byte of the page from your server. It covers redirects, DNS, the connection and the server's work to build the page. web.dev's TTFB guide suggests 0.8 seconds or less as a rough target, and notes that TTFB isn't a Core Web Vital, so it matters mainly because everything else waits for it.
A high TTFB points to the server, not the page design: slow or overloaded hosting, no page caching on a CMS like WordPress, a database doing too much work, a CDN that isn't caching HTML, or a chain of redirects before the page even starts. Each redirect hop adds a full round trip, so http://example.com → https://example.com → https://www.example.com/ costs time before anything loads. The Redirect Checker shows how many hops your addresses take. web.dev's guide to optimizing TTFB covers hosting, caching and CDN options.
Total Blocking Time (TBT)
TBT adds up how long the page's main thread was blocked by long tasks between first paint and becoming interactive, which is time the page couldn't respond to a tap. Chrome's TBT documentation rates 0–200 ms as fast on mobile and over 600 ms as slow. At 30%, it's the heaviest weight in the score.
TBT is almost always about JavaScript: large bundles, page builders, chat widgets, tag managers, A/B testing scripts and ads. It's the lab stand-in for INP, which needs real interactions and so can only be measured in the field. Fixes: remove scripts you don't need, load the rest with defer or async, delay third-party widgets until after the page loads, and split large bundles.
Speed Index (SI)
Speed Index measures how quickly the visible part of the page fills in during loading. Lighthouse records a video of the load and scores how fast it becomes visually complete. Chrome's Speed Index documentation rates 0–3.4 seconds as fast on mobile. It improves with the same fixes as FCP and LCP: a faster server, less render-blocking code and smaller above-the-fold images.
Does PageSpeed Affect SEO?
Speed matters for SEO through Core Web Vitals, which come from real-visitor data, not from the PSI score. Google's Core Web Vitals documentation says it highly recommends achieving good Core Web Vitals "for success with Search," and that this aligns with what its core ranking systems seek to reward.
Two honest caveats. First, page experience is one signal among many: a slow page with the best answer can still outrank a fast page with a weak one. Second, the lab score itself isn't used for ranking, so going from 75 to 95 won't move rankings on its own unless it reflects real visitors getting a faster experience. Speed also matters for people: slow pages lose visitors before they ever read your content. And once a fast page ranks, its title and meta description decide whether people click. For how search itself is changing, see how AI agents are changing SEO.
How to Improve Your PageSpeed Score
Fix in this order: the server, then images, then JavaScript, then layout. Each step tends to improve several metrics at once.
- Speed up the server (TTFB). Turn on page caching, use a CDN, upgrade overloaded hosting and remove redirect hops in front of your pages.
- Shrink and prioritize the main image (LCP). Serve it at the size it's shown, in WebP or AVIF, never lazy-load it, and add
fetchpriority="high". The Image Size Checker finds the heavy images on any page. - Cut render-blocking CSS and JavaScript (FCP, Speed Index). Inline critical CSS, defer the rest, and load scripts with
defer. - Reduce JavaScript (TBT, INP). Remove unused plugins and widgets, delay chat and tracking scripts, and audit your tag manager.
- Reserve space for everything (CLS). Give images, videos, ads and embeds a width and height.
- Re-test three times and check field data again after 28 days, since that's how long the real-visitor window takes to fully reflect a change.
On WordPress, a caching plugin, an image optimization plugin and removing unused page-builder add-ons usually make the biggest difference. On Shopify, the most common culprits are apps that each add their own scripts, and oversized product images.
PageSpeed Insights vs Lighthouse vs the Search Console Report
| Tool | Data | Best for |
|---|---|---|
| PageSpeed Insights | Field (CrUX) + lab (Lighthouse) | One page, both views at once |
| Lighthouse in Chrome DevTools | Lab only, run on your own computer | Testing changes before you publish |
| Search Console Core Web Vitals report | Field only, grouped across your site | Finding which groups of pages fail |
| Chrome User Experience Report (CrUX) | Field only, raw dataset | Trends and comparisons over months |
Use PSI for a quick, complete look at one page, Search Console to see which templates are failing across the site, and Lighthouse locally to test a fix before it goes live.
Speed Is One Part of a Healthy Page
Run your most important page through PageSpeed Insights on mobile, read the real-visitor verdict first, and fix the single slowest metric before anything else. Then look at the rest of what makes a page work on phones in our mobile-friendly checklist, and make sure the page can actually be found with our guide to why a page isn't indexed. To keep pages fast after updates, Watch Owl crawls your whole site and can run a PageSpeed (Lighthouse) score for any page it finds, Owl-gorithm Hacker audits the technical SEO around it, and Opportunity Owl turns the findings into specific fixes.
FAQ
Is PageSpeed Insights free?
Yes. PageSpeed Insights is free to use at pagespeed.web.dev with no account, and it works on any public URL. Developers can also query it through a free API with a key and usage limits.
Is PageSpeed Insights accurate?
Its field data is real Chrome visitors' experience over 28 days, which is as accurate as speed data gets. The lab score is one simulated test, so it varies between runs; use it to find problems, not as an exact measurement.
Why is my mobile score lower than desktop?
The mobile test simulates a mid-range phone on a throttled connection, while desktop uses a faster machine and network. Lower mobile scores are normal; the mobile result matters more because Google indexes the mobile version of pages.
What is a good PageSpeed score?
90 to 100 is good, 50 to 89 needs improvement and 0 to 49 is poor. Passing Core Web Vitals in the real-visitor section matters more than the score itself.
What is a good TTFB?
0.8 seconds or less is a good target, according to web.dev, and over 1.8 seconds is poor. TTFB isn't a Core Web Vital, but a slow TTFB delays every other metric.
Does LCP include TTFB?
Yes. LCP is measured from the start of navigation, so the time spent waiting for the server is part of it. A slow server makes LCP slow even if the image itself is small.
What is Total Blocking Time?
It's the total time the page's main thread was blocked by long tasks while loading, when it couldn't respond to input. It's lab-only, weighted 30% in the score, and is usually caused by JavaScript.
Why does PageSpeed Insights say there's no real-user data?
The page is too new or has too few Chrome visitors to be included in the Chrome User Experience Report. PSI then shows data for your whole site if it has enough, or only the lab test.
Sources
- About PageSpeed Insights, Google for Developers.
- Lighthouse performance scoring, Chrome for Developers.
- Total Blocking Time and Speed Index, Chrome for Developers.
- First Contentful Paint (FCP), web.dev.
- Time to First Byte (TTFB) and Optimize Time to First Byte, web.dev.
- Why lab and field data can be different, web.dev.
- Chrome UX Report, Chrome for Developers.
- Understanding Core Web Vitals and Google search results, Google Search Central.